|
|
Using the Price Matrix
Using the Price Matrix function of the T-Quoter is an easy way to allow you to use your own prices lists you might already have setup in your business. We will first take a look at the different sections of the Price Matrix screen and what function each section performs.
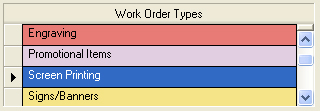
WORK ORDER TYPES
You must first select a work order type that you would like to create a price matrix for. By clicking on the work order you would like to create or modify, you will notice that the title of the matrix will also change to SCREEN PRINTING MATRIX RANGES. The active work order is always highlighted in blue. In Fig. 1 we have selected the SCREEN PRINTING work order type.
|
|
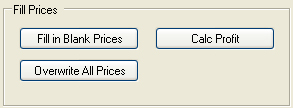
FILL PRICES & FILL LOCATIONS & COLORS
The T-Quoter allows you to manually enter the prices you would like to charge or are being charged for a particular quantity range and number of colors. However, if you do not want to manually enter in pricing you can allow the T-Quoter to do the calculations for you based off of the overhead and labor expenses you entered into the program.
|
|
There are several buttons within this group that perform several different functions. These buttons and functions are:
Fill in Blank Prices: Clicking this button will only fill in cells within the price matrix that have a value of $0.00. It will use the appropriate calculations for the work order type and suggest what you need to be charging for that number of colors and quantity range.
Overwrite All Prices: Clicking this button will overwrite all of the prices you currently have in the matrix. The T-Quoter will ask you if you are sure you want to do this because any prices that you manually entered into the grid will be overwritten with the automatic calculations for that particular work order type.
Calc Profit: This will automatically calculate out the profit for each cell in the grid based off of the Markup Percentage for that quantity range and then fill in the FORMULA PROFIT/LOSS row for each color and quantity range.
Markup Percentage
The Markup Percentage area of the Price Matrix screen allows you to specify the amount of markup for that price range. This MARKUP PERCENTAGE will markup both the cost of the garment selected as well as the printing costs in the actual PRICE MATRIX grid.
|
|
MATRIX RANGES
The Matrix Ranges of the Price Matrix screen allow you to set the From and To values for the quantity ranges. You can change any of these values simply by clicking on the From or the To value you would like to change and then type in the value you would like it to be. The T-Quoter will then automatically adjust the next From or the previous To values to reflect the changes you made.
|
|
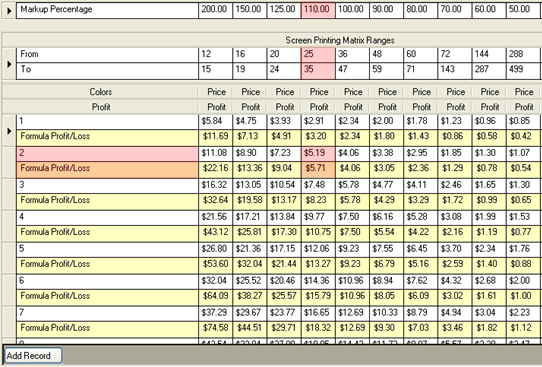
THE PRICE MATRIX
The PRICE MATRIX is setup to allow you to enter in your price list you want for a quantity range and number of colors or you can press the OVERWRITE ALL button and have the T-Quoter fill in the cells of the Price Matrix for you using the Formula associated with that work order. The Price Matrix itself offers you a lot of flexibility in being able to price out your jobs.
We will take a look at how the price matrix works using the screen shot in Fig. 4 above. We will take a sample job that is a 2 color imprint on 25 shirts.
Since we know the job is a 2 color imprint we go down the PROFIT column (far left column) of the price matrix. This column contains two rows for each color (number of imprints). In our example we would scroll down this column until we come to the 2 color row and 2 color profit/loss row which is highlighted in Fig. 4.
We also know that the customer wants 25 shirts. So, we scroll across the top of the Price Matrix until we come to the 25-35 quantity range. This also is highlighted in Fig. 4.
If we scroll across and down to where these two intersect we find 2 cells that are also highlighted in Fig. 4. These 2 cells are contain the following information:
The Top Cell - COST TO PRODUCE ITEM: The cell that is in the same row as the number of colors and is considered the cost for that quantity range and number of colors, in our example the number of colors is 2 and the value in this cell in Fig. 4 is $5.19. The price in this cell is what either your costs are in producing a 2 color imprint in the 25-35 quantity range are or, if you choose to have the T-Quoter fill it automatically, it is what it costs you to produce this job based off the information you have entered in for your expenses and overhead.
The Bottom Cell - BUSINESS PROFIT/LOSS OF ITEM: The cell that is in the same row as the Profit/Loss row, in Fig. 4 above is $5.71. This figure is calculated based upon the markup for that quantity range which is 110%. The Profit/Loss cell for this quantity range and number of colors is 110% x $5.19 = $5.71
How the T-Quoter Gets the Final Price for an Item
The T-Quoter calculates out the final cost to the customer using the following formula from the price matrix. The first item listed below is the cost of the item from the database. The price for this item is calculated by the actual database cost for the item + the amount of markup for that item from the BUSINESS PROFIT icon/ TARGETED MARKUP selection. This matrix allows you to set the markup on the garment or item based on the dollar value of the item. If you have the markup set for 100% and the item costs $2.00 then the T-Quoter will automatically adjust the price of the selected item to be $4.00. See the section on Target Profit for more information on changing these values.
(Cost of the Selected Item from the work order Item pull down list x Markup Percentage for that Price Range)
+ COST TO PRODUCE ITEM
+ BUSINESS PROFIT/LOSS OF ITEM
= Final Piece Price of Item
So, the final piece price that the customer pays is a simply mathematics formula. Additional imprint locations are pulled from the matrix table and then added to the cost of a single imprinted item.